TREND ANALYSIS
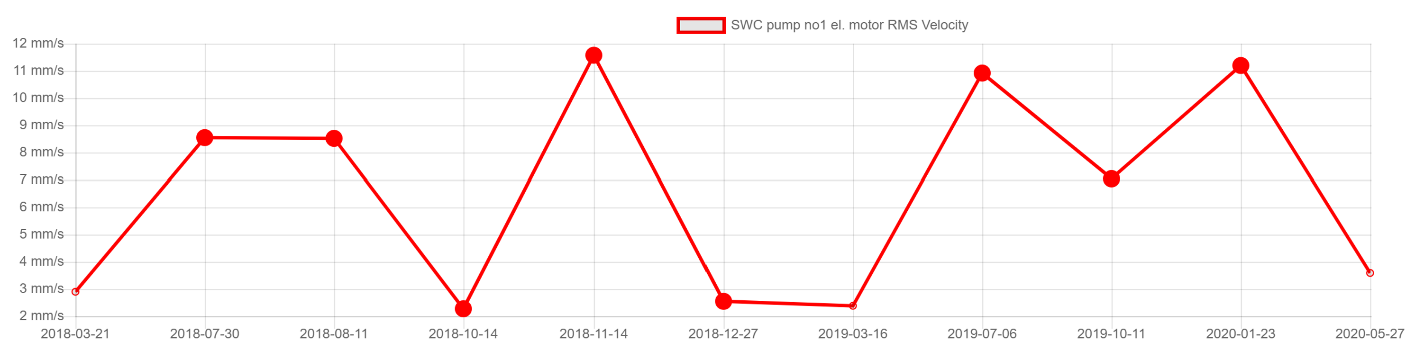
While presenting different types of vibration alarms, that we can use for assessment of machinery condition, we pointed out that trend analysis is a better way than just plain comparing vibration values with limits. Trend analysis allows us to monitor if condition of machinery (vibration values) are really changing. Quite often we can have machinery that will have vibration values above ISO limits, but no fault will be developing, and machinery can normally work with such vibrations. Alarming thing for us is when we see increasing vibration signal. Below you can see trend results from bow thruster. As you can see, we have constantly increased vibration values on el. motor. It should be noted that ISO standard considers vibration limit of 11.2 mm/s for such this type of machinery.
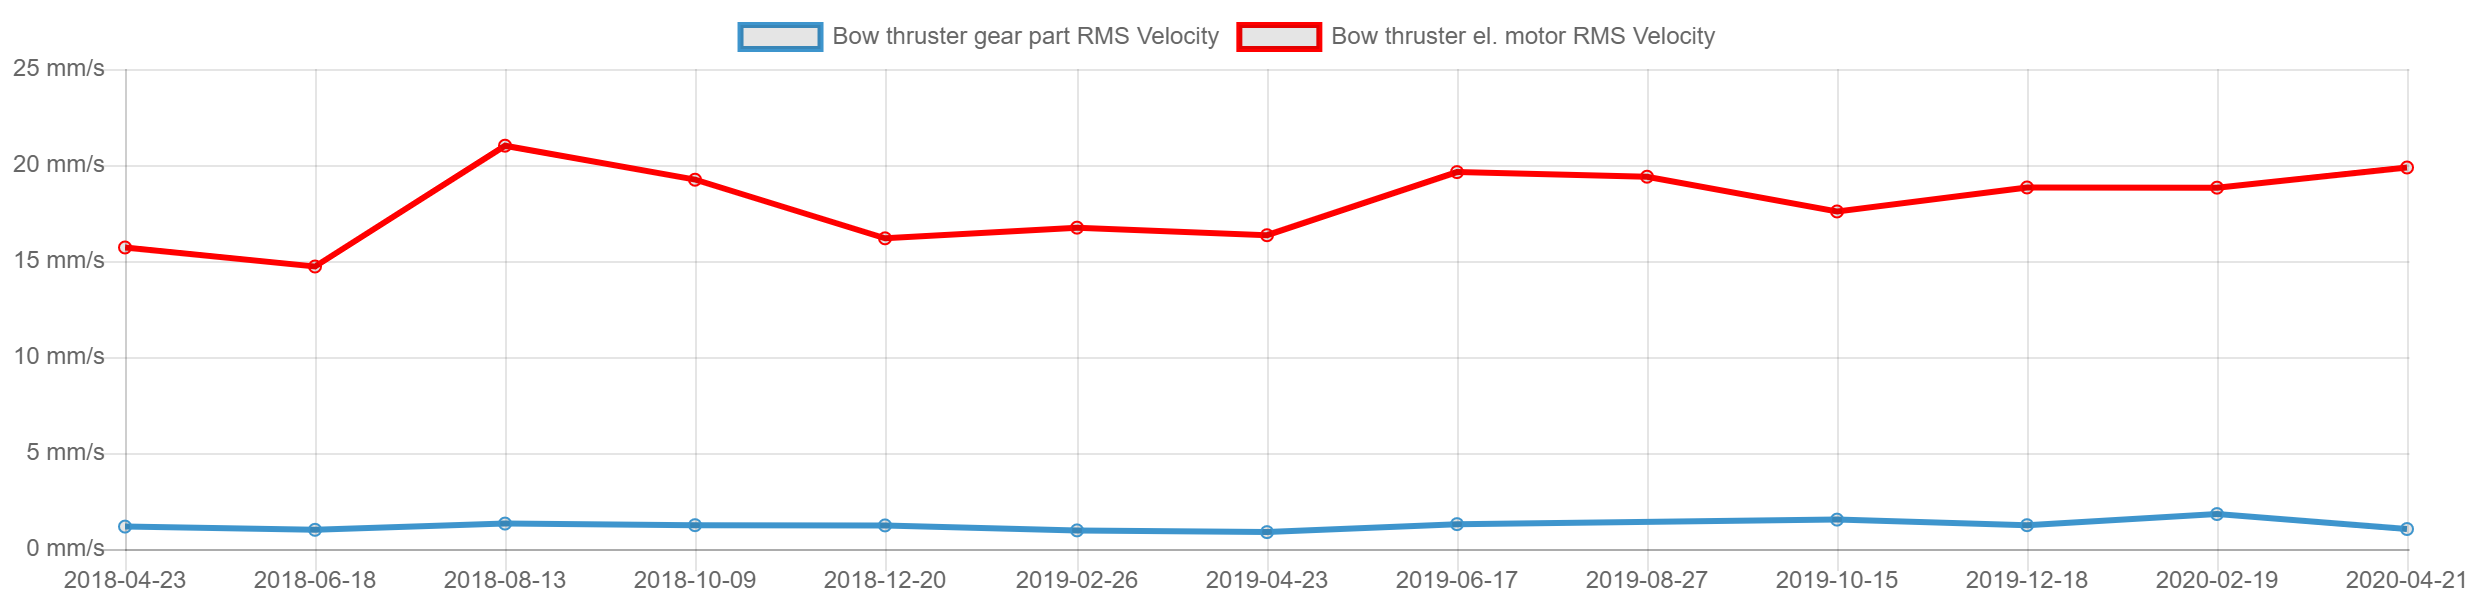
During those two years of condition monitoring of this bow thruster no damage was found. This shows that ISO limits are not the best method to determine condition of this thruster.
But, if we would notice that the signal started to increase in value, then we would have different situation. What we are looking for, is constant rising of signal for amount of measurements that would indicate repeatable trend.
We must set some rules on when we will act on our increasing trend. This should be considered individually for each type of machinery. A good starting point would be to consider a constant rising trend for 3 measurements and increase from original baseline signal of about 150%. When we notice that signal is growing, we should reduce measurement intervals to make sure we take another measurement before breakdown. In case of exponential characteristics of trend, it can be necessary to act quicker.
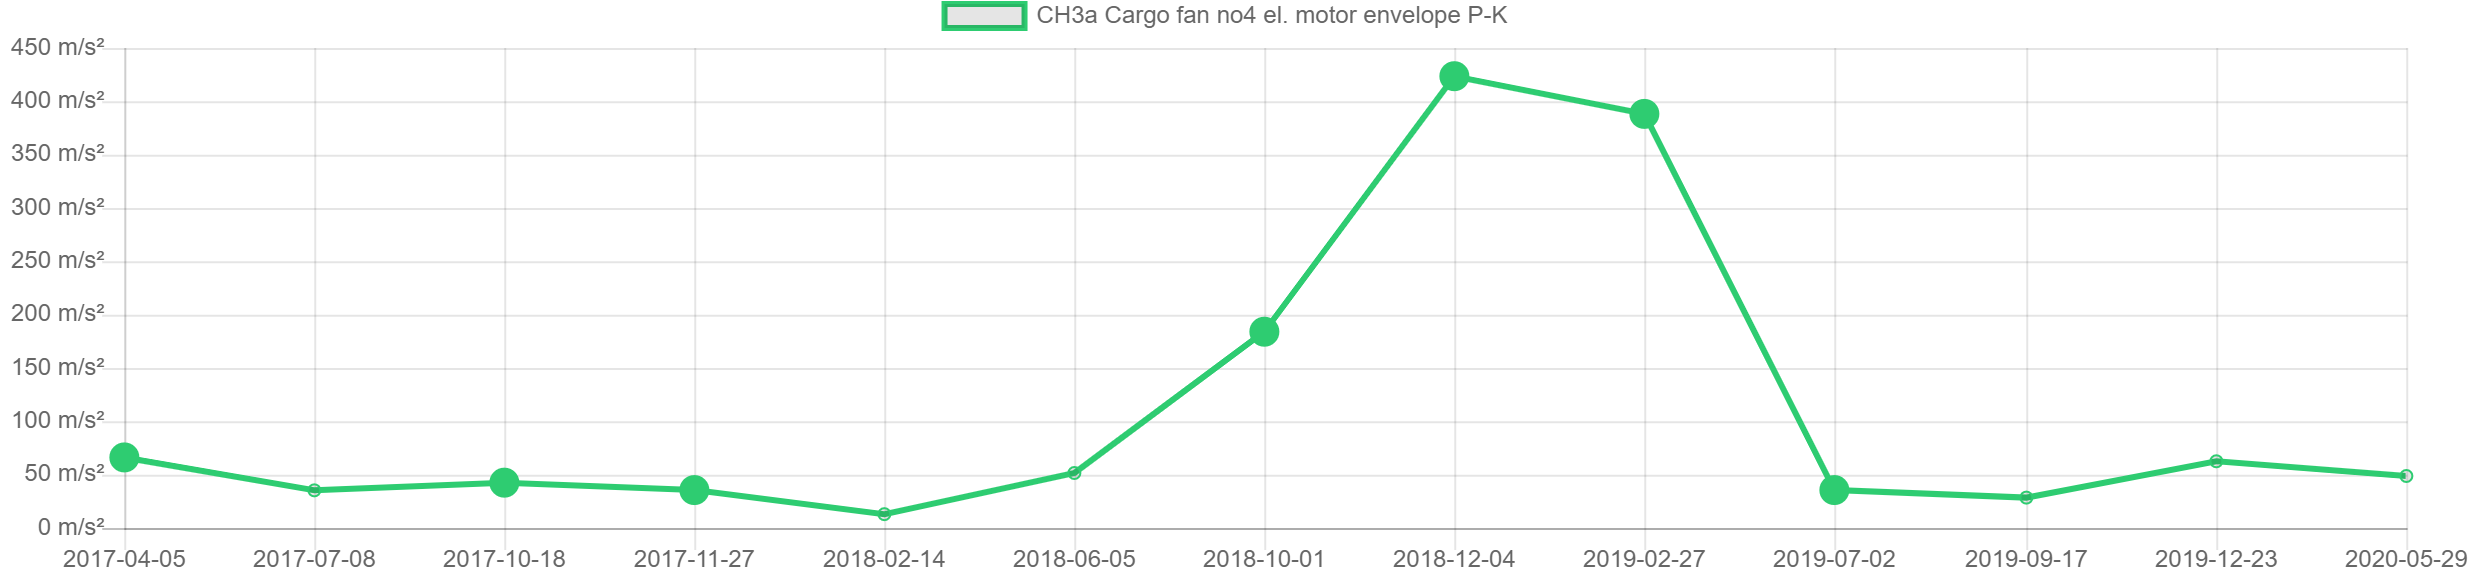
From trend characteristics we can also make some predictions on how the signal will increase in future. If we have linear trend graph with not so steep slop, then we may plan overhaul for the future and monitor trend until we see in signal that now will be the best time to perform maintenance.
But if we have signal rising in exponential matter it may be required to act as soon as possible.
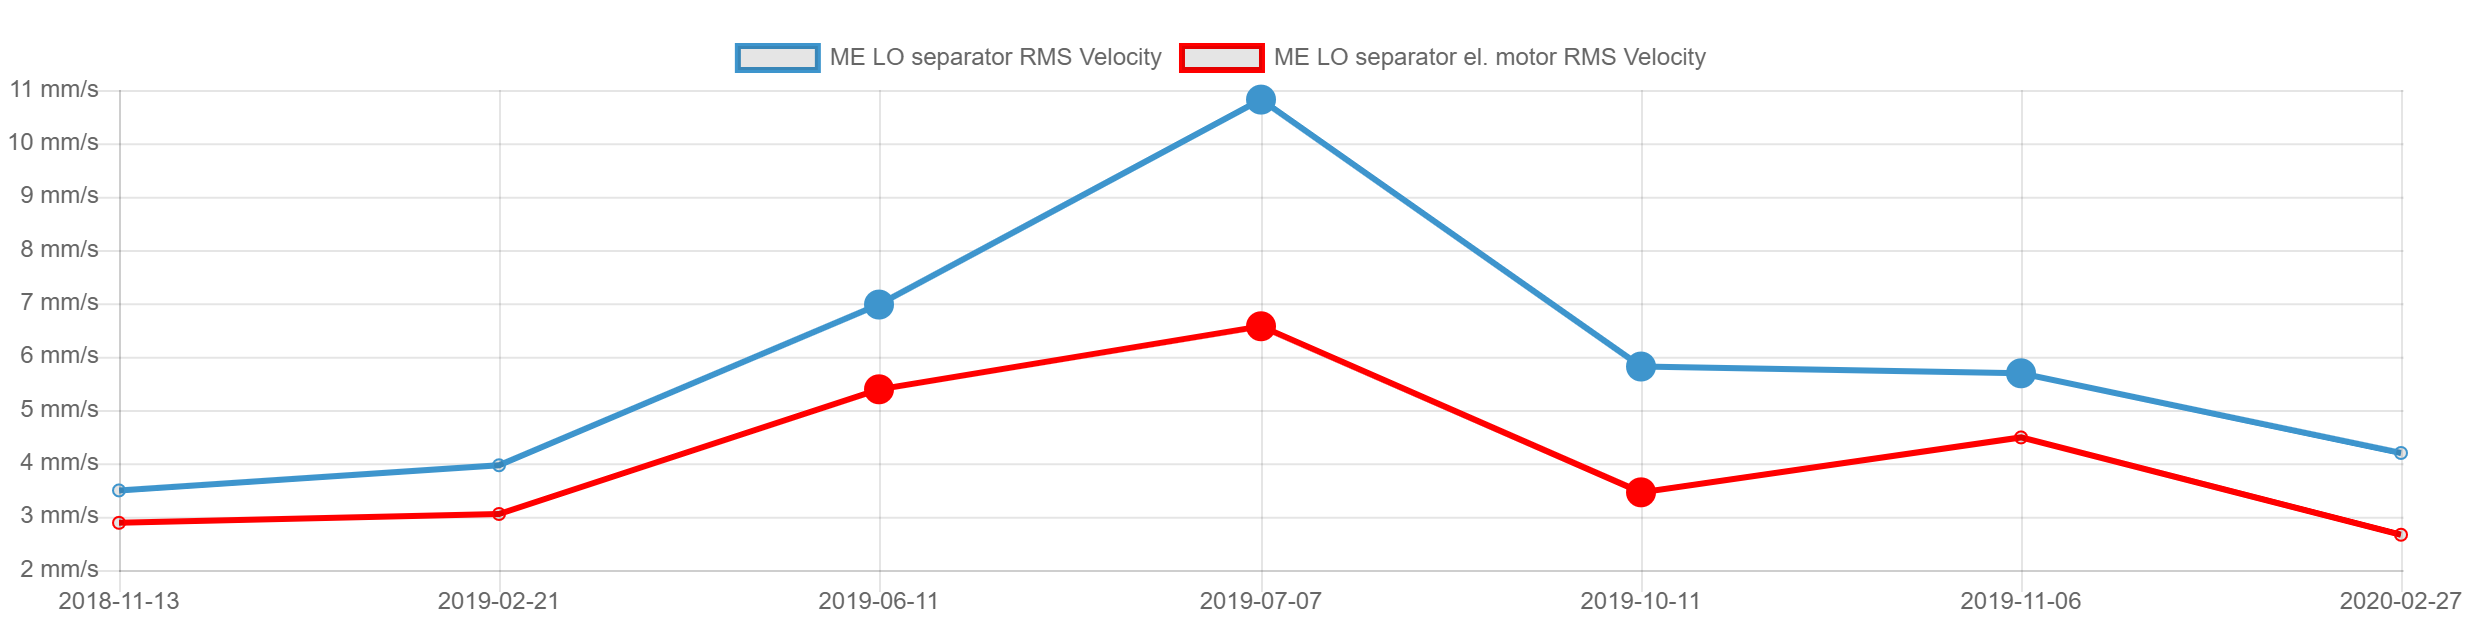
In trend analysis, as well in vibration diagnostic at all, repeatability of measurement is essential. To have reliable trend we need to be sure that changes in vibration signal are generated solely because of changing condition of machinery. To be sure that it is true, vibration readings need to be taken from same measurement points, with same accelerometer mounting technique. Additionally, we need to pay attention to working and surrounding parameter during which measurements are taken. Changes in load, rpm, pressure, whether vibrations were taken with Main Engine running or stopped will greatly influence vibration values. Below is presented trend graph from machine with variable working conditions during measurements.
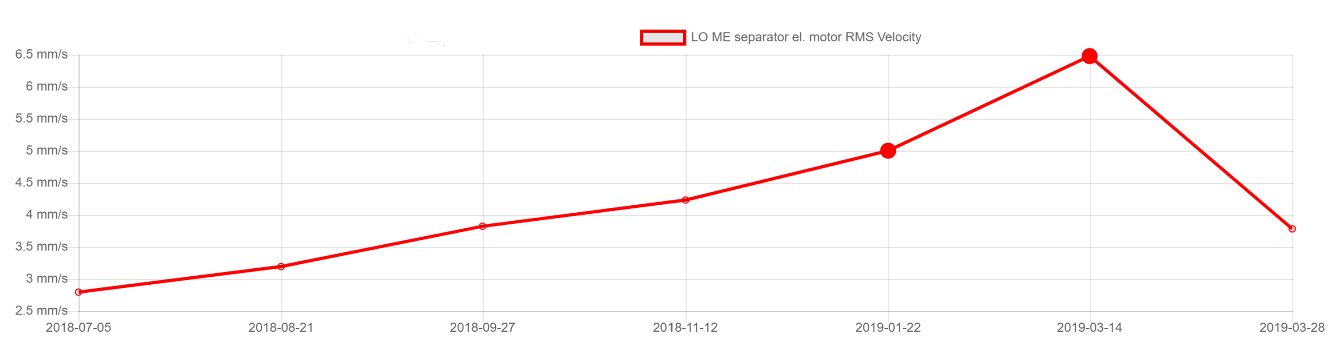
In next example some of vibration were taken during voyage and some with ME stopped.
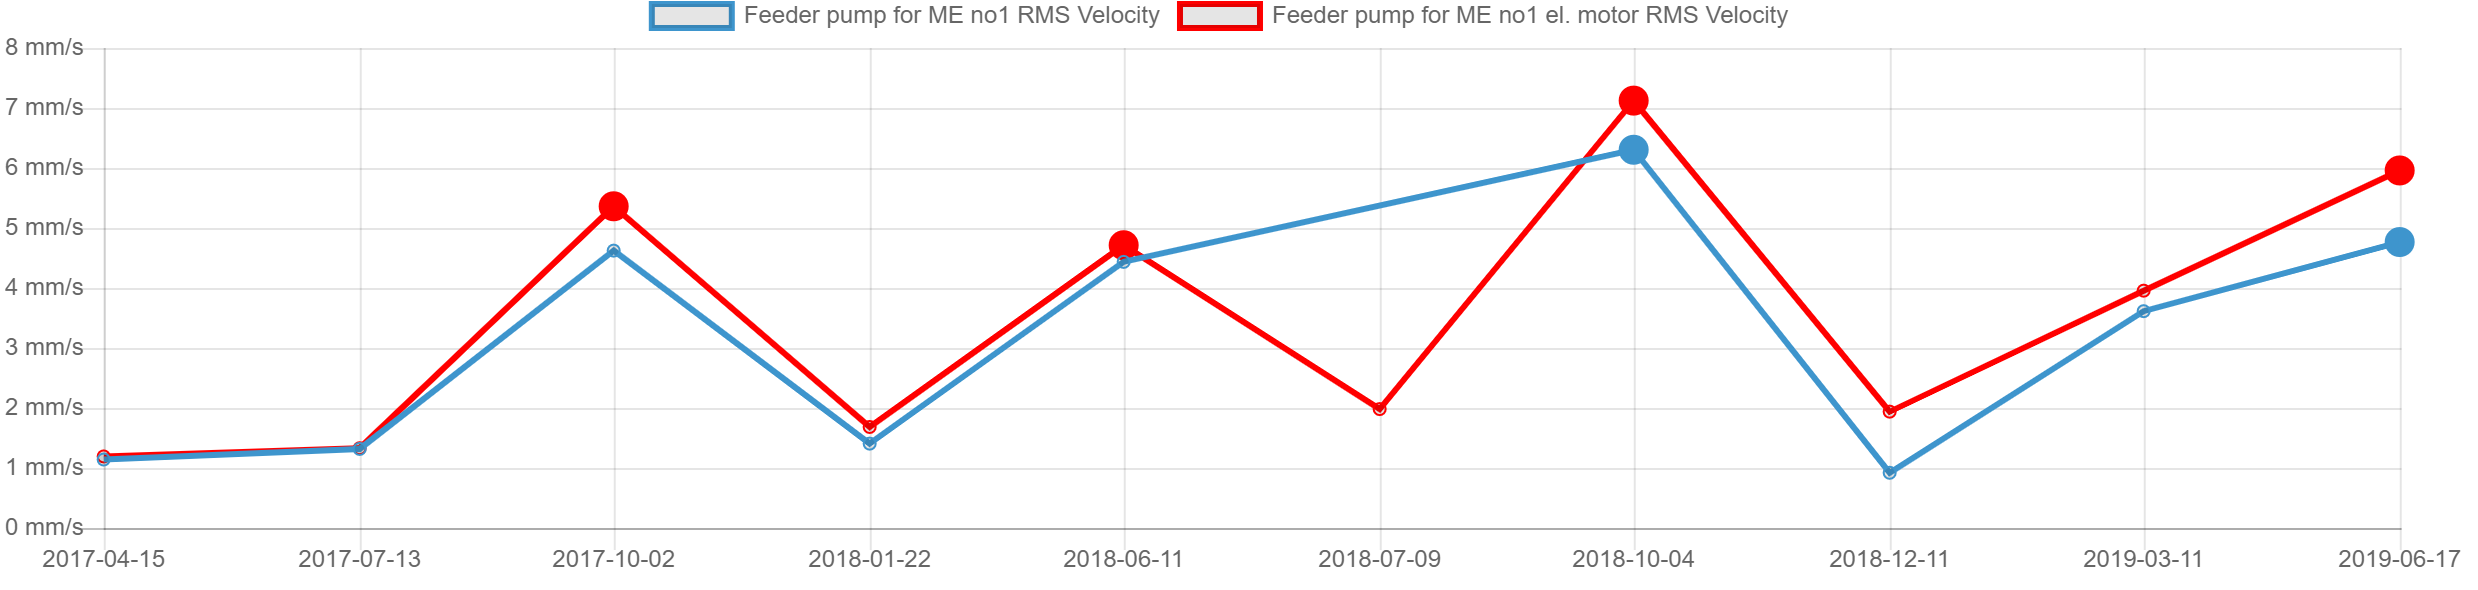
Performing valuable trend analysis from both those examples as they are is impossible. In cases where we have different conditions during measurements we can draw multiple trends for example one with ME stopped and one with ME running (at similar rpm) or one with high speed setting for el. motor and one with low speed setting.
Trend analysis is not 100% accurate. Sometimes fault will develop very quickly, and maintenance needs to be performed right after vibration shows first sight of defect. Trend may also be rising for reasons not related to condition of machinery like changing environmental conditions. To be sure about condition of machinery performing detailed spectrum analysis to diagnose actual source of vibration is required.
Patryk Brząkała
Senior Reliability Engineer
References:
[1] James E. Berry P.E. Technical Associates Of Charlotte, P.C. “Analysis I How to implement an effective condition monitoring program using vibration analysis” Second Edition 06.1997
[2] Sulo Lahdelma, Esko Juuso “Trend Analysis in Condition Monitoring of Process Equipments” 06.2011
[3] M.Luft, PRUFTECHNIK AG “Machinery diagnosis: Quick and easy through FFT analysis” 05.2010